Week 39 note: Performing capacity planning
A week note is a rough write-up about my experiences, thoughts, and ideas from the past week.
We made significant progress last week when we successfully performed capacity planning for two of our services which operate very centrally in our organization and are subject to high amount of traffic continuously. Why we needed to do this was because we are adopting an observability service with strict host limits.
We needed to ensure enough horizontal & vertical capacity in the services so that we could still serve requests as before BUT not too much so that we would not be in violation of the license.
We'd previously observed that we had overprovisioned our services. Due to the licensing costs, we set out to halve the number of instances for our services.
Using performance testing, our goal was to measure that 50% of the instances could perform the same load under peak traffic conditions. We'd thus focus on the performance of a single instance, ensuring that a single instance could run twice the load that it previously could.
We also wanted to guarantee that our services could be ran at 2-3 times the conditions at peak load. For example, let's imagine that the peak load would have been at 100 Requests Per Second (or RPS) for a single instance at peak load. We would try to guarantee we can get that using an average-load test scenario, and then we would try to guarantee 200-300 RPS using some stress testing scenarios. In some cases though, we skipped the average-load scenario and went straight for the stress test scenario.
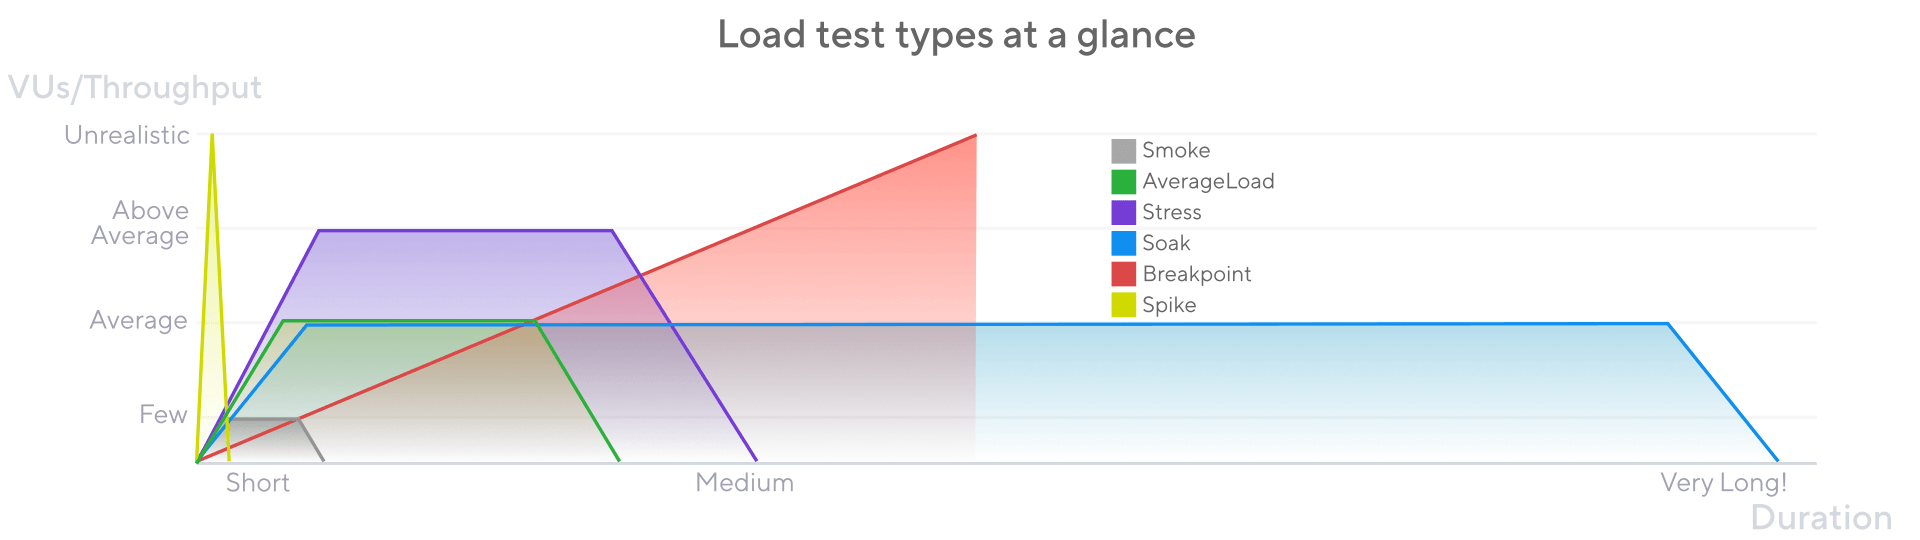 Types of load testing, by Grafana
We also ran a very simple breakpoint test after running the stress test scenarios to see big of a number we could get. Here's our breakpoint test scenario using k6:
{
  "executor": "ramping-arrival-rate",
  "stages": [
    {
      "duration": "2h",
      "target": 20000
    }
  ]
}
After running all of the test scenarios, we found out that we would safely be able run our services at peak load using 50% scale (or even at ~10% scale, we found out).
Using this as a basis, the services were readjusted to 50% scale in production and we were able to latch onto our new observability service. Sweet!
However, we made some potentially grave errors while trying to prove the higher peak loads.
We fixated on RPS/Instance when we should have focused on total peak load. The fixation was caused when we calculated the original production peak load down to a single instance. We should have then calculated back to a RPS total (or req/min) and focus on achieving that. Instead, we used RPS/Instance as an objective.
We should have also understood how the tested routes implement caching and take this into account during testing perhaps by having multiple scenarios: one cache-hit-heavy scenario and one cache-miss-heavy scenario, maybe a suitable mix of both (using realistic numbers from prod). Run all of them and gain a much better understanding as a result.
Third was that the cache probably hid the read dynamics to DynamoDB which is our primary database. It's possible that our load tests didn't cover enough of actual reading to the database which could mean we are performing better in the performance scenario than we actually would be in production.
Some smaller problems as well. We ran some tests and almost overwrote them by running another scenarios—running these on CI & storing the reports as artefacts definitely helped. At some point, we ran the tests from an external API gateway when we should have been using the internal ALB endpoint.
Finally, parting with some future thoughts. With the license limiting the horizontal scale, we still have the option of looking into vertical scale if necessary. For example, configuring Jetty to be more performant or investing in virtual threads (this is a JVM/Clojure service we are talking about). So we still have some options when it comes to the current architecture.